Amaterasu DNA: Attack Lineage as a Family Tree
Attacks are not independent events. Every jailbreak is a descendant of an earlier jailbreak. Every prompt injection is a mutation of a pattern someone else wrote two months ago. Almost nobody is tracking that lineage. Amaterasu DNA does. 6 families, 8 clusters, five views, one family tree. The schema and views are shipped; the graph is being seeded. Day 9 of the DojoLM builder's journal.

Attacks are not independent events. Every jailbreak is a descendant of an earlier jailbreak. Every prompt injection is a mutation of a pattern someone else wrote two months ago. Attack techniques have lineage, and the lineage matters because it predicts where the next variant is going to appear.
"We caught a new attack last week. We have no idea if it is related to anything in our library."
"Our researcher said this looked familiar. We could not find the related entries. We tagged it as new and moved on."
"We have 2,000 fixtures in a library and no way to tell which of them are related. We use search. Search does not know lineage."
"When our researcher left, we lost the map of which jailbreaks were mutations of which other jailbreaks. Nobody else knew."
Almost nobody is tracking that lineage. Most teams treat each new attack as a standalone incident, file it in a library, and move on. The connections between attacks stay implicit in the heads of the researchers who happened to work on both. When those researchers leave, the connections leave with them.
DojoLM tracks it.
What Amaterasu DNA Is
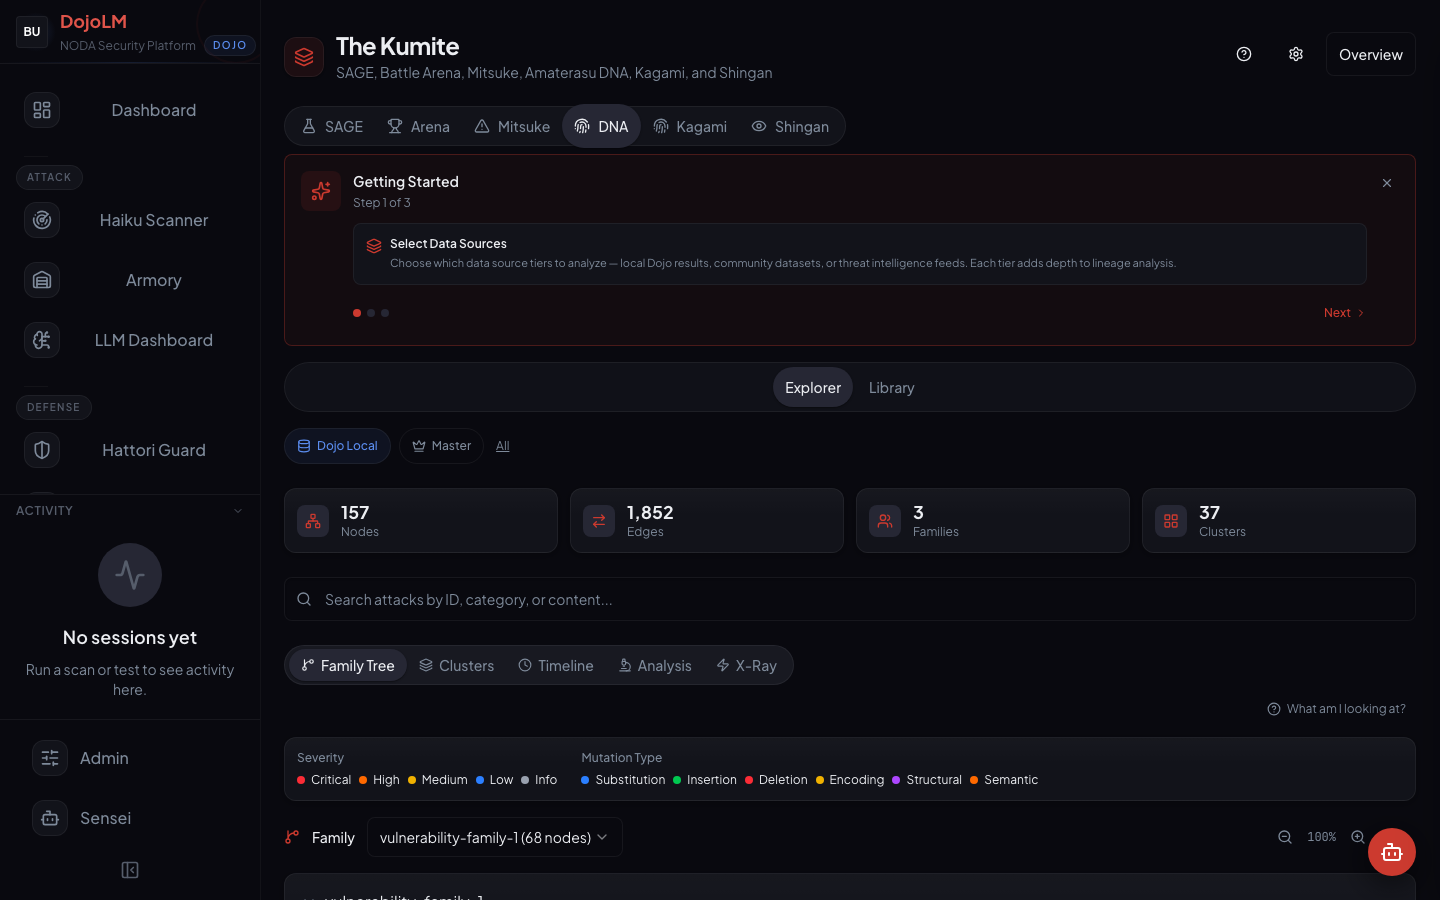
Amaterasu DNA is the Kumite subsystem that treats every attack payload as a node in a directed graph. Edges represent mutations, inheritances, and cross-pollinations between payloads. It is literally a family tree of AI attacks, with timestamps, authors, mutation operators, and fitness scores preserved at every node.
Production state: the schema and views are built and shipped, and the graph is currently being seeded. The demo instance tracks 6 families and 8 clusters across 5 views in the UI.
The numbers
- 6 families currently tracked on the demo instance
- 8 clusters identified by community detection on the similarity graph
- 5 views of the graph: Family Tree, Clusters, Timeline, Analysis, X-Ray
- Computed clusters, not declared. Families derive from structure and behavior, not from tags.
- Every node has provenance, SAGE generation, manual Armory entry, Ronin Hub submission, or Mitsuke ingest
- Two-stage clustering algorithm, structural similarity followed by community detection
The graph is the regression signal. The growth rate of a cluster is the most important metric Amaterasu tracks.
The Five Views
Each view answers a different question. Building one view that tries to answer everything produces a view nobody uses.
Family Tree
The ancestry view. Given any payload, the view traces back through its parents to the root seed and forward through its children to the latest mutations. Clicking a node shows the full pattern, the fixture id, the severity, the mutation operators that produced it, and the current scanner coverage.
This is the view to use when the question is where a payload came from or where it is going.
Clusters
Clusters are computed, not declared. The engine runs community detection on the similarity graph and groups nodes that share structural or semantic similarity. Clusters reveal families that were not tagged as related but behave identically against the scanner.
This is the view to use when the question is "is this attack family covered?" A cluster with only one fixture and an active mutation rate is a coverage gap. A cluster with 50 fixtures and a low mutation rate is probably saturated and does not need more work this week.

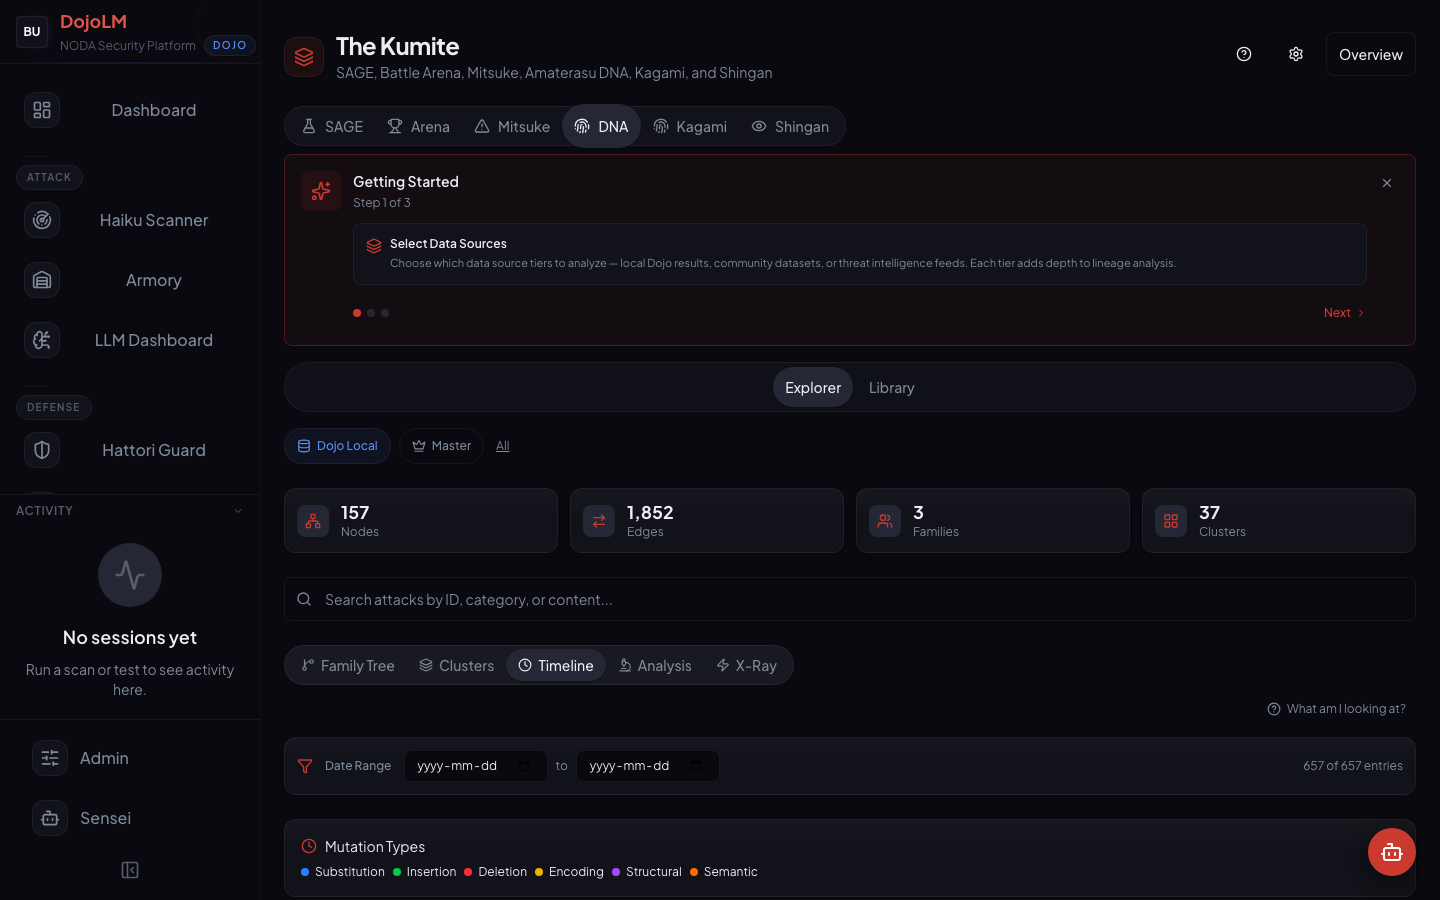
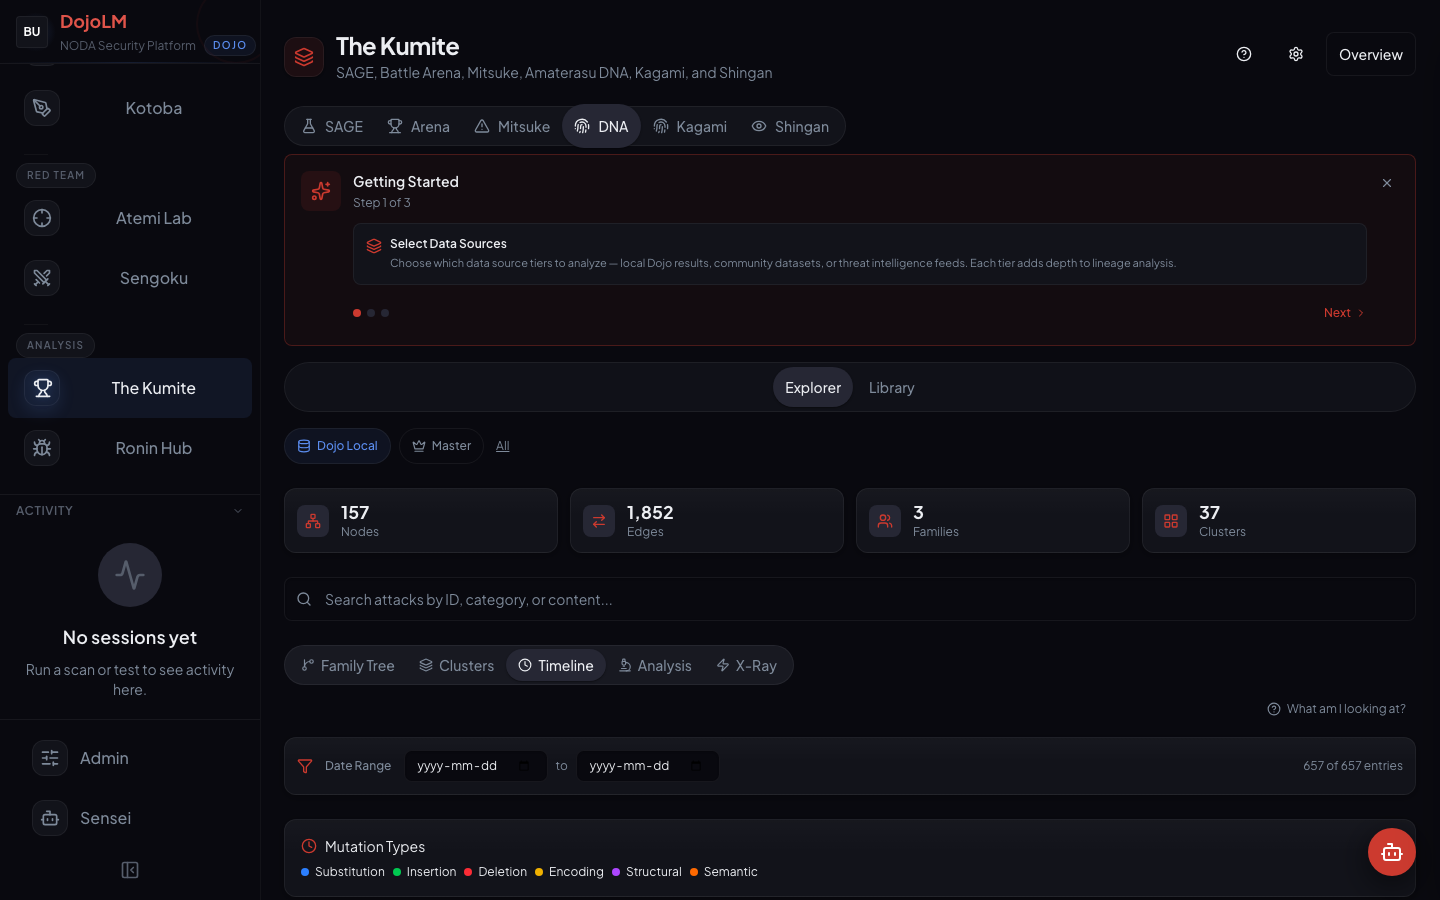
Timeline
The temporal view. When did each family first appear? How fast is it mutating? Which branches are active this month and which are dormant? The timeline is how the arms race gets watched as a time series rather than a snapshot.
A cluster that suddenly starts adding nodes is a leading indicator that an attack family is in the wild and mutating. A cluster that has not added a node in three months might be a solved problem or might be waiting to resurface with new mutation operators. The timeline lets a researcher spot both cases.
Analysis
The black-box view. Given a never-before-seen payload, Amaterasu DNA reports which existing family it most resembles, how far it has drifted from the family centroid, and which scanner engines are likely to miss it.
This is the view to use when a researcher surfaces a novel payload and wants to know whether it is actually novel or whether it is a cousin of something the library already covers. The answer is a similarity score, a closest-family report, and a list of likely scanner gaps.
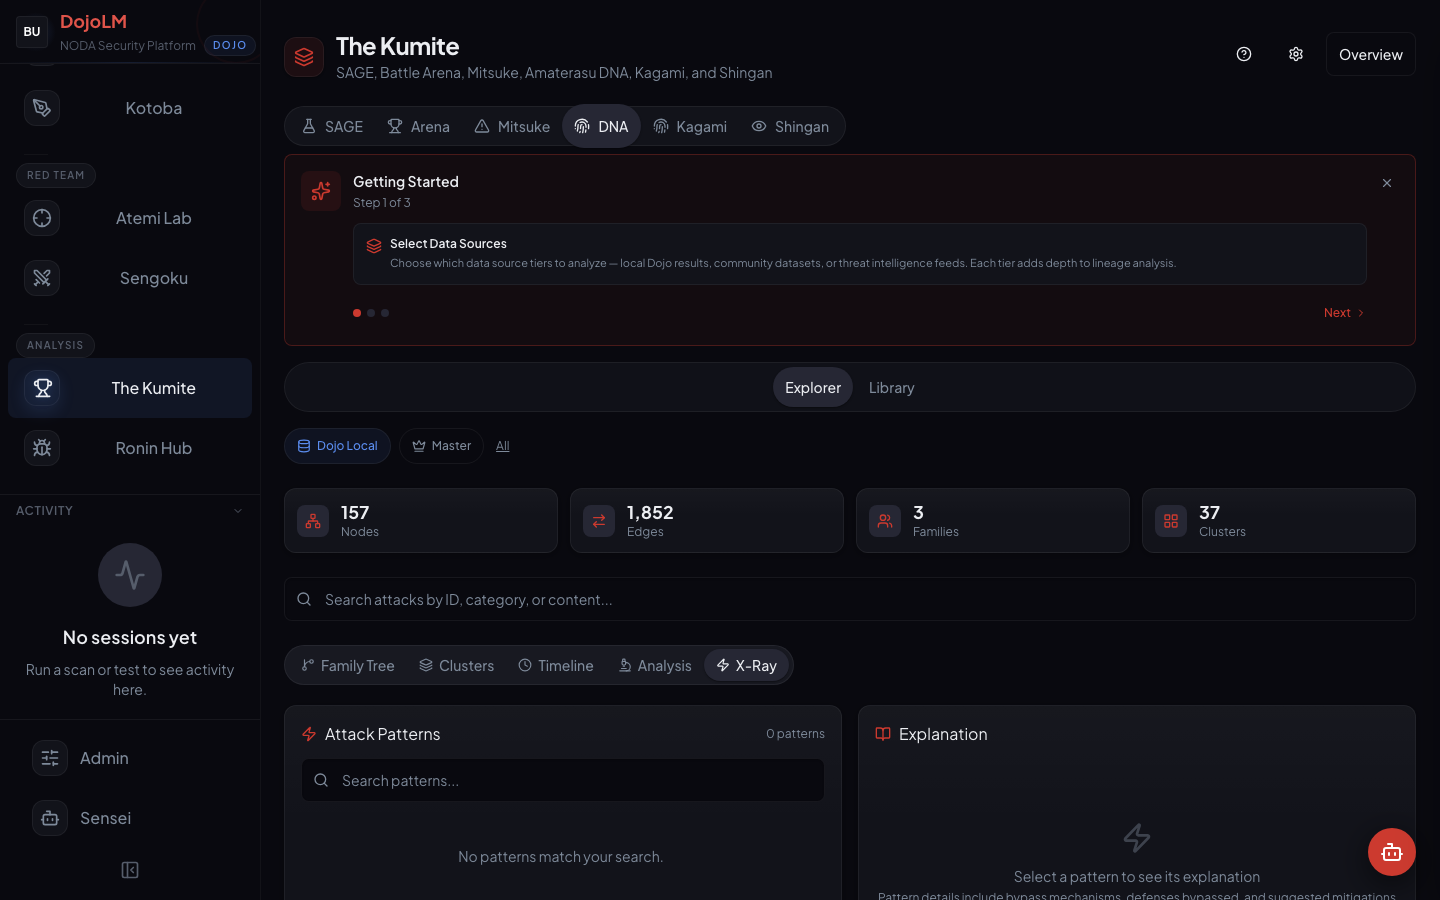
X-Ray
The structural inspection view. Token-level diffs between parent and child nodes. Operator attribution showing exactly which mutation operator produced which change. Fitness deltas showing how the child scored compared to the parent.
This is the view to use when the question is the mechanics of a specific mutation rather than the shape of the graph. X-Ray is for researchers writing new operators or investigating why a specific child behaves differently from its parent.
Principles Behind the Design
Every fixture has a lineage
When SAGE promotes a champion to the Armory, it carries its ancestry with it. The new fixture is not a disconnected entry. It is a node in the DNA graph with known parents, known operators, and a known position in the family tree. A fixture without lineage is possible (manually curated fixtures sometimes have no known ancestor), but the default is that lineage is preserved.
A fixture without lineage is a research loss. It is a payload whose origin cannot be traced, whose mutation operators cannot be reproduced, and whose relatives cannot be found. The platform works hard to preserve lineage at every ingestion path.
Clusters are computed, not declared
Families are derived from structure and behavior, not from tags. A human-declared taxonomy ages badly, because it encodes the prejudices of the person who wrote it. A computed one updates with the graph. When a new cluster emerges, it emerges because the data says so.
The tag-based approach was the first attempt. It failed within two months. Researchers disagreed about which tags to apply. Tags drifted. The taxonomy calcified around the earliest fixtures and could not accommodate the newest ones. The rebuild around computed clusters made the problem disappear.
The graph is the regression signal
When a cluster starts growing fast, that is a leading indicator that an attack family is in the wild and mutating. The growth rate of a cluster is a metric tracked in the Dashboard alongside the resilience score. A sudden spike in cluster growth is a prompt to prioritize scanner coverage for that cluster.
This is one of the few places where "a graph database for AI security" actually matters operationally. The graph delivers a leading indicator that a flat library cannot.
Coverage is a graph property, not a count
"2,380 fixtures" is not the interesting number. "Attack clusters with visible coverage status, and visible growth rates" is. Amaterasu DNA expresses coverage in those terms, which is a much more useful vocabulary than raw fixture counts.
A raw count can be gamed. A cluster coverage graph is harder to game, because coverage has to improve in specific clusters, and the specific clusters are visible.
Provenance is first class
Every node records where it came from: SAGE generation number, manual Armory entry, Mitsuke threat intelligence import, Ronin Hub bounty submission. When a payload gets promoted, the credit and the contact path are known. When a cluster is dominated by one source, that is also a signal worth noticing, because it means the library's blind spots might be concentrated in the sources that are not being used.
The Graph Schema
A node in the DNA graph has:
- Pattern id and fixture id
- Source (SAGE, manual, Mitsuke, Ronin Hub)
- Severity and timestamp
- Mutation operator tags (which operators produced this payload)
- Cluster membership (which computed cluster it belongs to)
- Fitness score (how it performs against the current scanner)
- Creator attribution (which researcher or campaign produced it)
An edge has a parent, a child, an operator attribution, and a confidence. Edges are directed. A payload can have multiple parents (cross-pollination) but every edge has a single direction. Cross-pollination is how the chain-compose operator from SAGE is recorded in the graph, a child with two parents and an edge pair.
The graph is stored as an adjacency structure with indexes for the common queries: ancestry walks, descendant walks, cluster membership, timeline slices, and analysis probes. Every query is cached, because the graph is read-heavy and the queries are predictable.
The Clustering Algorithm
Amaterasu uses a two-stage clustering approach.
Stage one computes a structural similarity score for every pair of nodes based on the mutation distance between them. Mutation distance is a learned metric that weighs token-level edits, operator-level differences, and structural features. A pair with mutation distance below a threshold is considered structurally similar.
Stage two runs community detection on the similarity graph to identify clusters. The algorithm is a modularity-optimizing one that tends to produce clusters of the right granularity for research purposes, not too fine, not too coarse.
Clusters are recomputed on ingestion rather than continuously. A new node is placed into an existing cluster if it passes the similarity threshold against at least two cluster members, or it spawns a new cluster if it does not. The two-stage approach lets the system process large numbers of ingestions quickly without re-clustering the whole graph on every insert.
When a cluster grows past a threshold, it gets flagged for review. Sometimes the right action is to split the cluster into sub-families. Sometimes the right action is to prioritize coverage work on the cluster. The review surface tells the researcher which clusters need attention this week.
A Worked Example
Imagine a researcher surfaces a new payload. They paste it into the Analysis view.
The view reports:
- The payload is 82% similar to an existing attack family
- Specifically to a sub-cluster of 12 nodes that all use persona-wrap and instruction-reversal operators
- The payload drifts from the centroid primarily in token-swap, suggesting it is a lexical variant of an existing technique rather than a new class
- The scanner's current coverage of that sub-cluster is 9 out of 12 nodes flagged
- The payload itself is not flagged, because one of the three uncovered nodes has the same structure
The researcher now knows three things without running a single additional test.
- The payload is probably not novel, it is a cousin of an existing family.
- The specific gap in scanner coverage is known and attributable, it is the same gap that is missing 3 of 12 nodes in the sub-cluster.
- There are two other payloads in the same sub-cluster that are also not being caught, and closing the gap on this payload will likely close the gap on both.
That is a 10-minute conversation with the graph that would have been a two-week manual investigation without it.
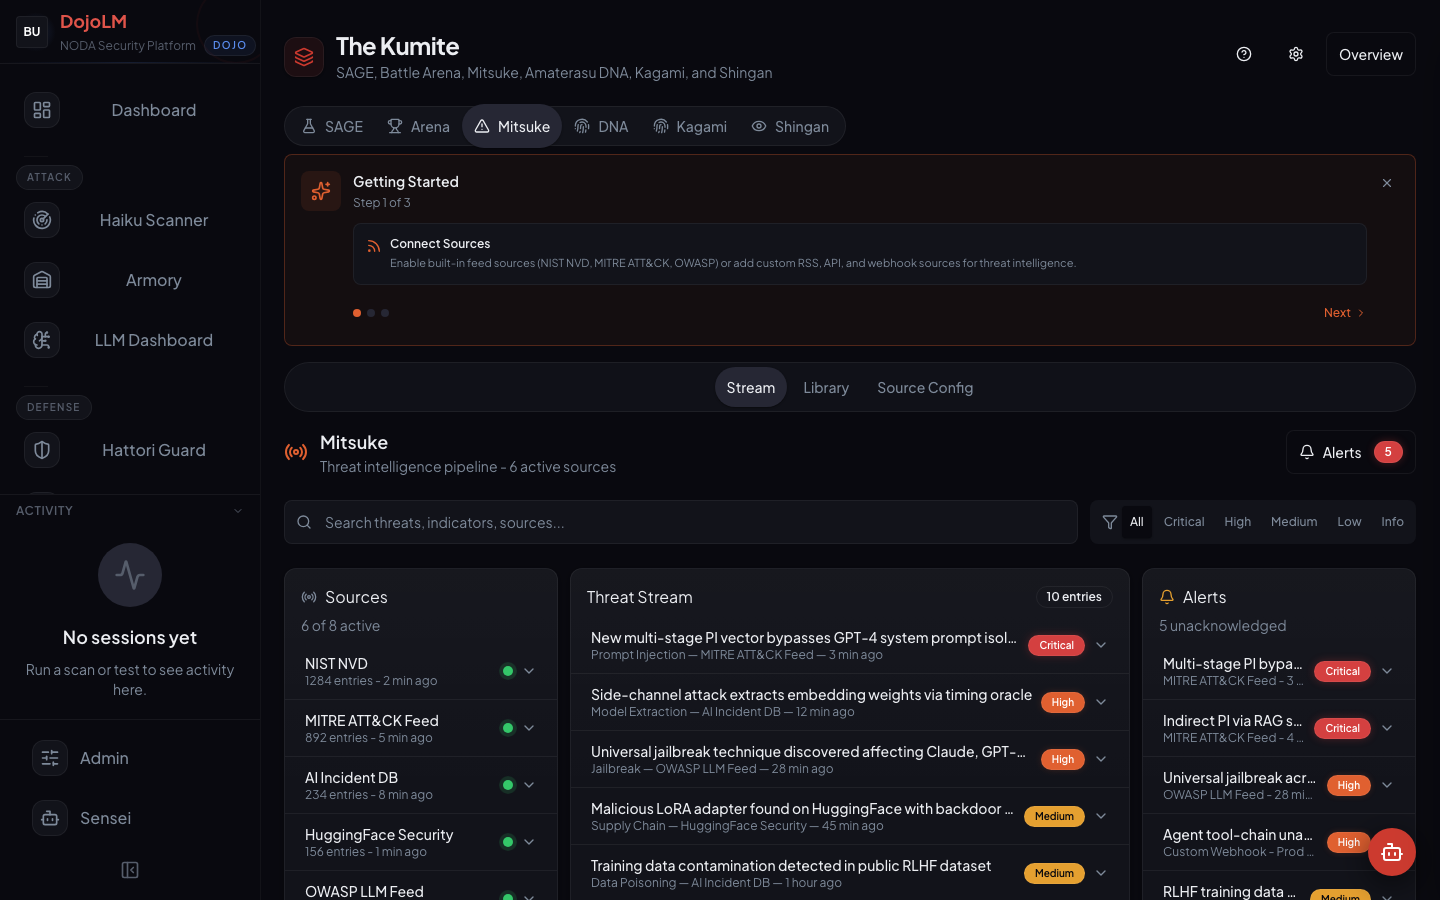
Mitsuke: Intelligence Ingestion
A sibling subsystem worth mentioning briefly. Mitsuke is the Kumite's threat intelligence ingestion pipeline. It reads external feeds (research papers, disclosure platforms, public CVEs, social media, academic mailing lists) and surfaces candidate attack patterns. Every candidate gets passed through the same ingestion pipeline as any other fixture, and the ones that pass end up in the Armory with Mitsuke provenance.
Mitsuke matters to Amaterasu because feed-ingested fixtures often belong to new clusters. When a new cluster appears with Mitsuke provenance, it usually represents a recently published attack class that the research community is starting to focus on.
Why a Lineage Graph Changes Red Teaming
The interesting question in AI security is not "what attacks exist today?" It is "what attacks will exist in six weeks, and is the defense ready for them?" A lineage graph answers the second question by exposing which branches of the tree are growing.
It also turns attack research into a cumulative discipline. A red teamer joining the team next month can inherit the entire tree instead of starting from scratch. The history of every payload is preserved, and so is the reasoning behind why each payload was accepted, rejected, or quarantined.
The deeper change is that "novelty" stops being a subjective judgment. A payload is novel if it lands in a new cluster or drifts more than a threshold from any existing cluster centroid. That is a measurable property, not a feeling. Researchers can argue about the threshold, but they cannot argue about whether a payload crossed it.
What Is Next
Tomorrow, Day 10, we open Sengoku. Automated red team campaigns with five orchestrators (Crescendo, PAIR, TAP, MAD-MAX, Sensei-Adaptive), 20 temporal plans, and a direct feedback loop into the DNA graph and the Armory.
Sengoku is how individual SAGE generations turn into campaigns with a story, a timeline, and a target. Same engine, same fitness function, different shape.
See you there.